Australia is winning the battery race. Now what?
Issue 13: Australia's grid batteries are starting to matter, but the real future could be right under our noses.
Why the headline numbers flatter us, what “enough storage” actually means, and why the next move is sitting in two million garages.
It's South Australia leading Arizona by a nose
A US grid analyst I follow, John Bistline, posted a chart last week that has been getting a lot of attention: the share of total US generating capacity made up of batteries, by state, since 2018. On John’s data Arizona leads at almost 30%. California is at 20%. Texas, Nevada, New Mexico are all rising hard. The key message is that battery storage on the US grid has crossed from a curiosity to a structural feature. I wondered how Australia would look on the same chart.
It turns out that we are not behind. We are neck-and-neck with leading US states.
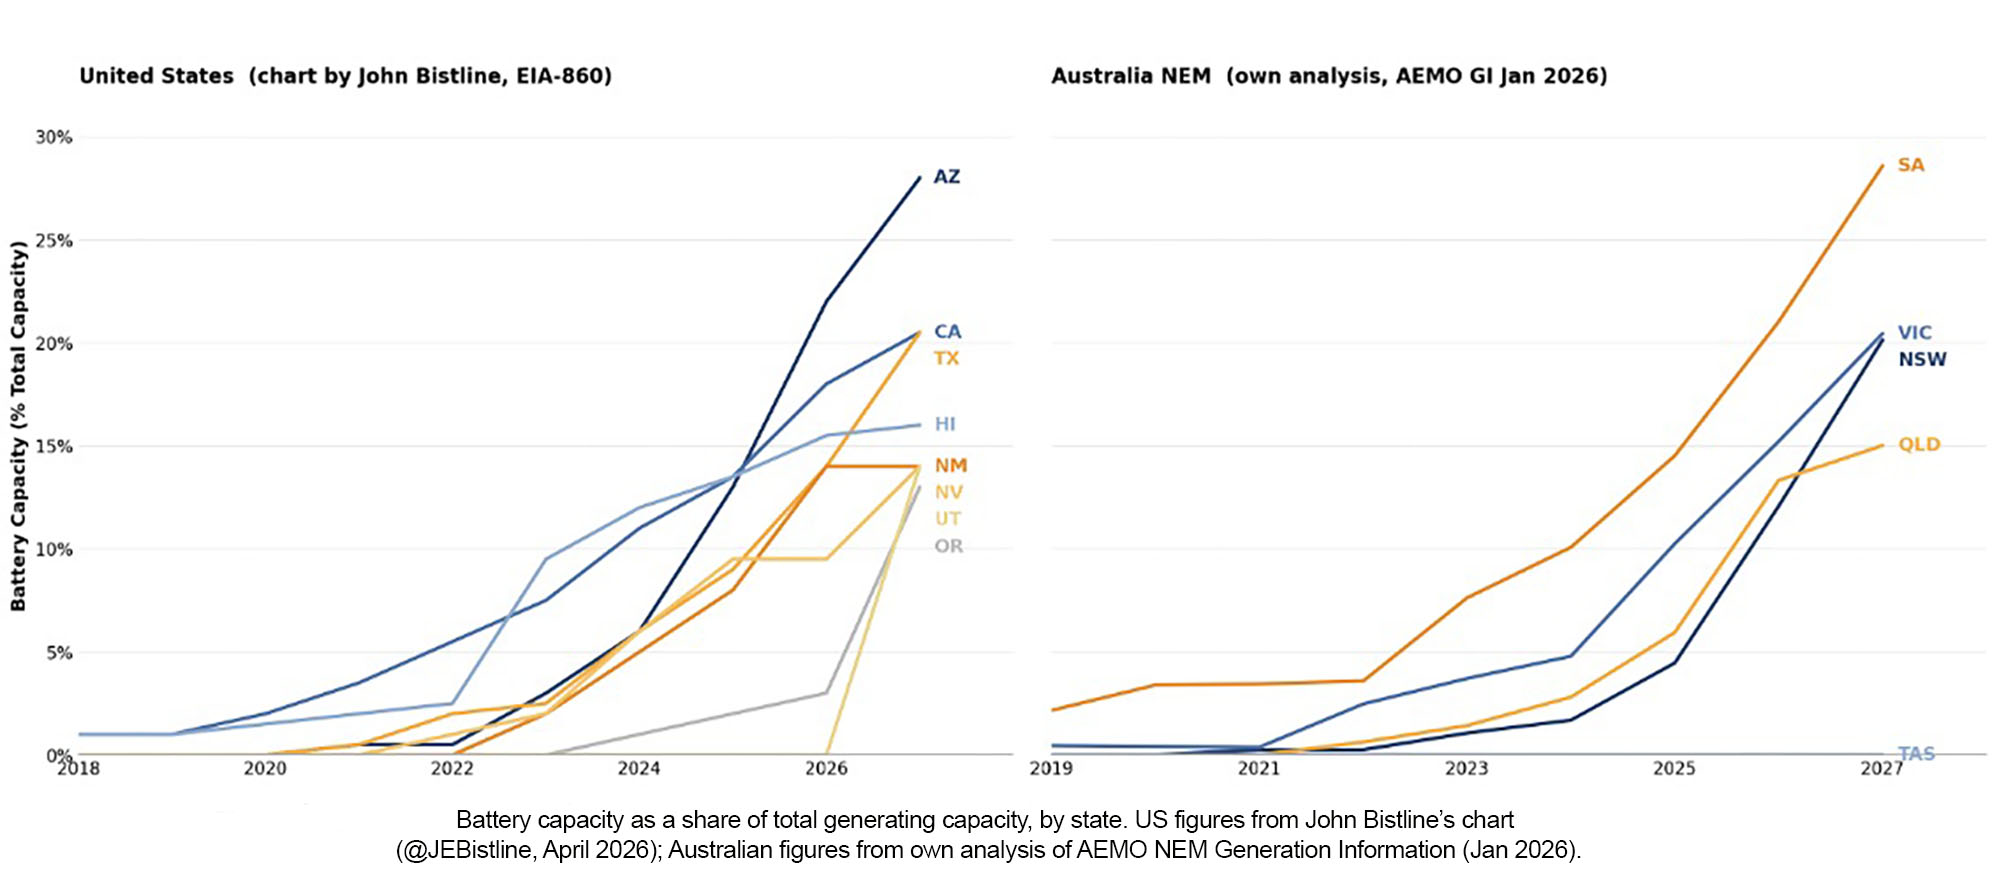
On a like-for-like basis, Victoria and New South Wales are at about 20% by 2027, right alongside California and Texas. South Australia is closer to 30%, in line with Arizona. Queensland is tracking Hawaii, New Mexico and Nevada at 15%. Tasmania does not really need batteries because it has hydro. The shape of the line is the same in both countries: essentially flat through 2022, a steep climb from 2023, and a continued ramp into the committed pipeline. There is a small caveat. Our denominators are smaller, so the same number of MW of battery shows up as a higher percentage. But that does not change the basic story. Australia’s grid-scale batteries are now a structural feature, and the build-out is accelerating, not slowing.
But that is only half the picture
Australia is unusual in two ways: rooftop solar penetration is the highest in the world, and home battery installations have just gone exponential. To analyse battery share properly, we need to add behind-the-meter (BTM) generation and storage to both the numerator and the denominator. The dotted lines in the chart below do exactly that.
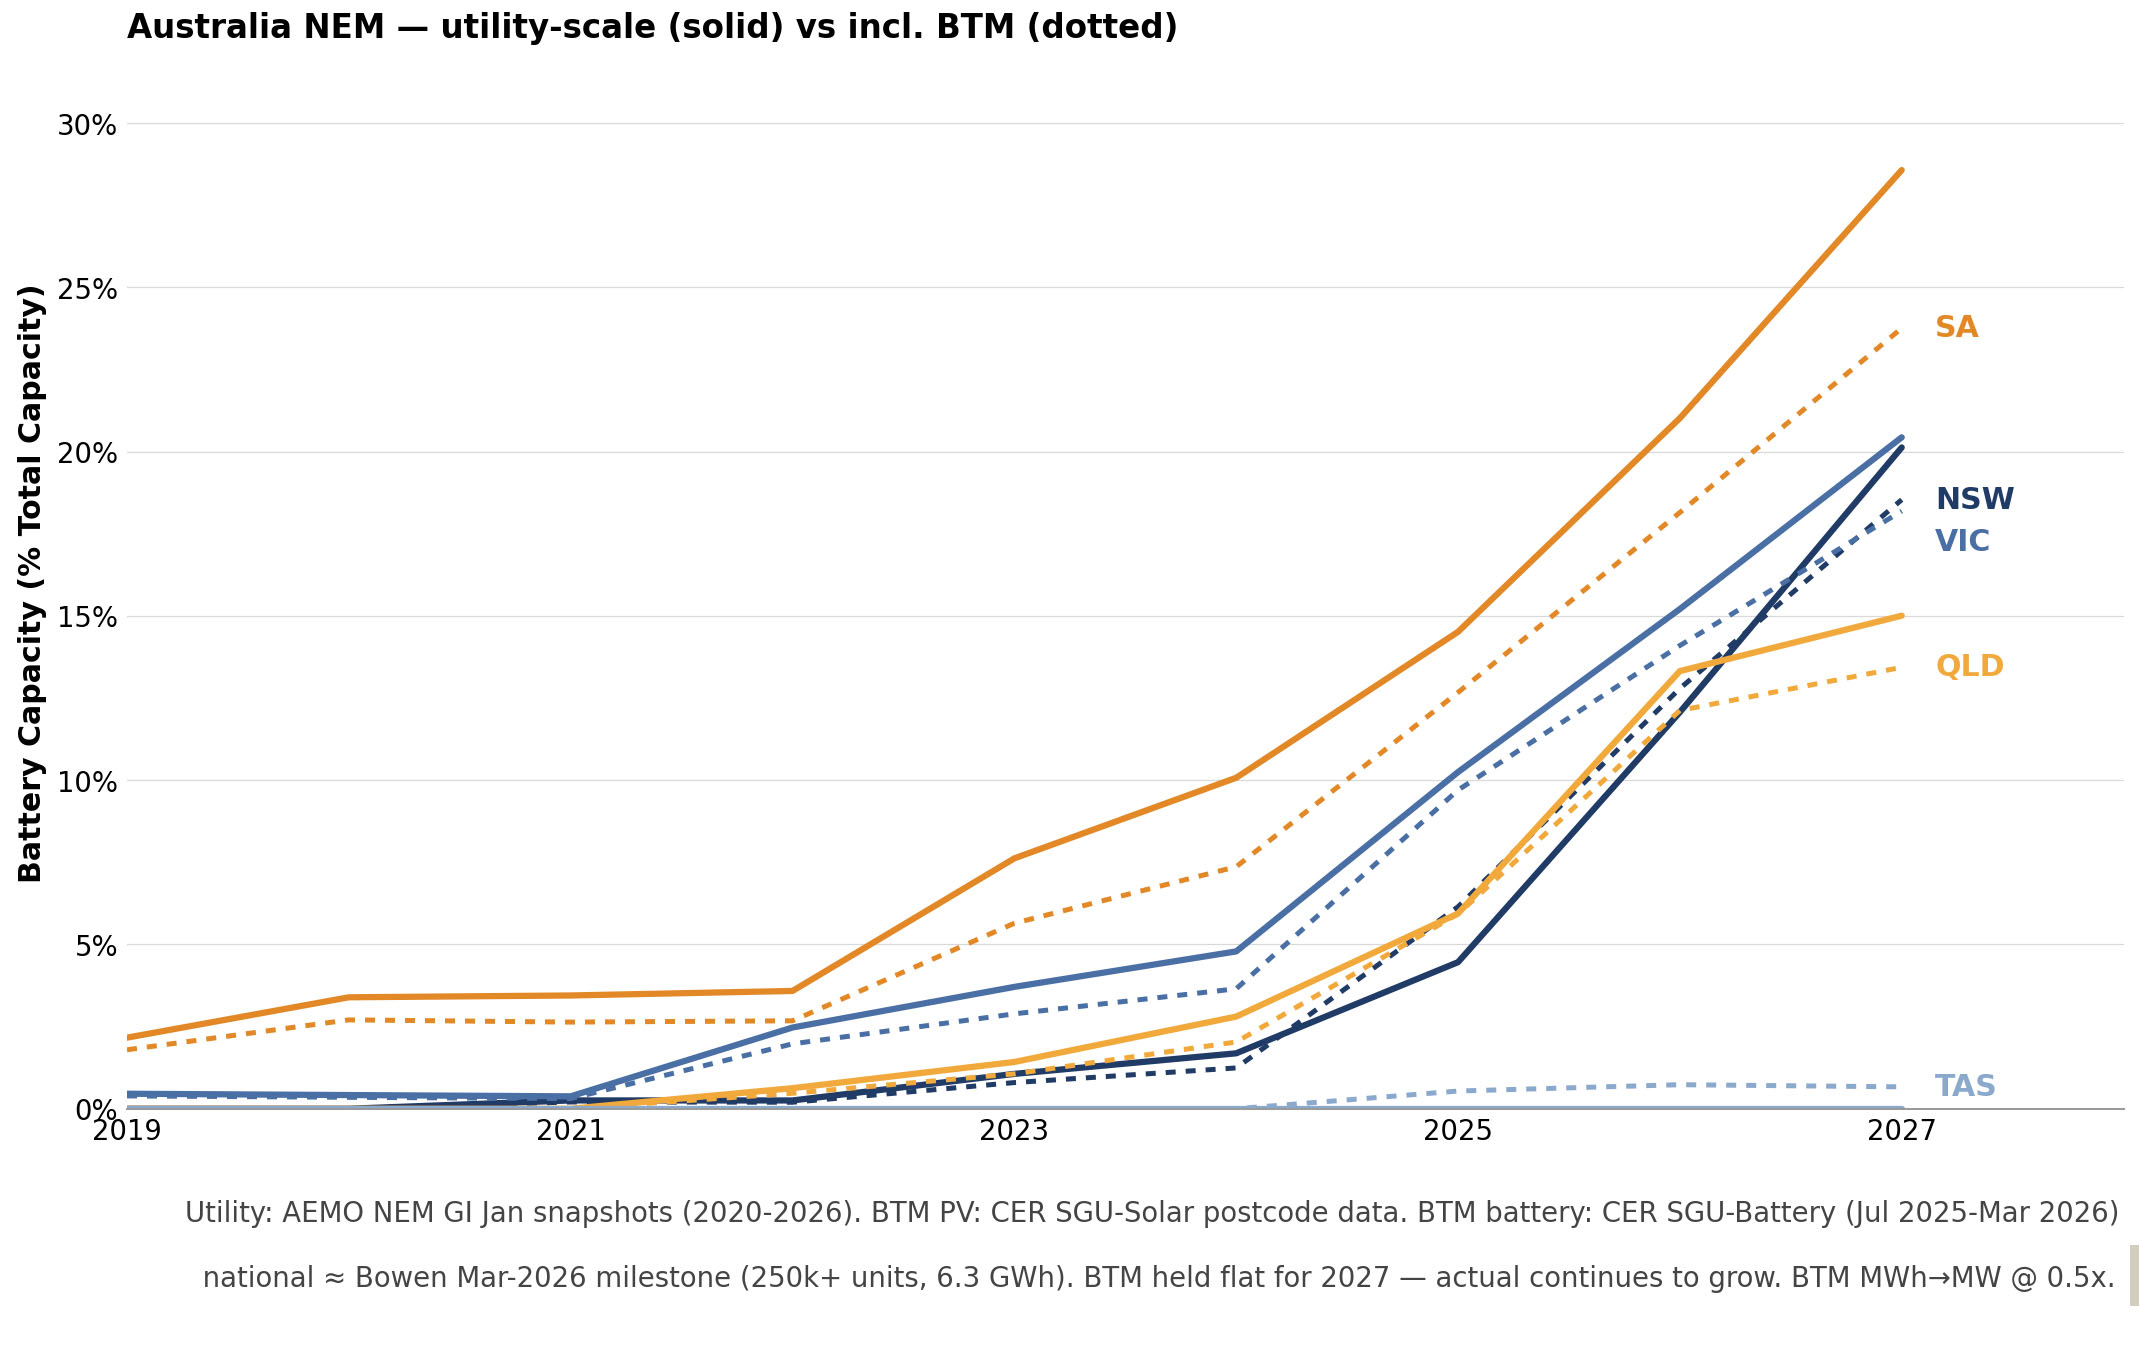
The first thing to notice is how far the dotted lines sit below the solid lines. That is because Australia has so much more rooftop solar than home batteries. Over 27 GW of rooftop PV is sitting on the denominator, and until recently the home battery numerator was barely registering. Adding BTM to the calculation actually made our battery share look worse, not better.
That has now started to change. The Federal Government’s Cheaper Home Batteries Program launched in July 2025. By March 2026, Minister Bowen confirmed the milestone: more than 250,000 home batteries installed under the program, totalling 6.3 GWh of storage. The CER’s underlying postcode data shows the same shape — the dotted lines for NSW, VIC and QLD all kick up visibly through 2025 and into 2026 as home batteries finally start narrowing the gap that rooftop solar opened up.
So what does “enough” storage actually look like?
The interesting question is not the percentage. It is when we have enough storage to shift day into night. There are two distinct milestones here, and the gap between them matters more than either one in isolation.
The first milestone arrives soon. Once utility batteries can cover roughly half of the evening peak for four hours, they begin to eat into the gas peakers that set the marginal price between four and eight in the evening. Because batteries are lower marginal cost once charged, they start setting the price in those hours. For the NEM as a whole, that threshold is around 70 GWh of dispatchable storage. Hawaii, California and New Mexico are already near or through that line. So is South Australia in our market. The California market CAISO now routinely shifts midday solar into the evening peak. The NEM reaches the same territory around 2027–28 if the committed battery pipeline is delivered. From there, evening wholesale prices should compress on many days. The old 200 to 400 dollars per MWh (20 to 40 cents per kWh) shoulder-period peak starts moving toward something calmer, and the 1,000 dollar per MWh plus spikes (a dollar per kWh and higher) become increasingly confined to heatwaves, outages and still-wind evenings.
It is important to be clear about what this milestone is, and what it is not. It is a transitional equilibrium. Coal, hydro and gas still cover the half of overnight demand that batteries do not meet. South Australia is “tipped” only because Heywood interconnect imports from Victorian brown coal cover its overnight gap. New South Wales reaches the same point properly when Waratah, plus another 80 GWh or so of additional storage, replaces Eraring (which retires in August 2027). What we get at this milestone is cheaper, less volatile evenings on a generation fleet that is still anchored by thermal plant overnight. That is a meaningful improvement, but it is not yet a renewables-led grid.
The second milestone is the structural one. Here the requirement is a system that runs overnight from yesterday’s solar, day after day. The arithmetic is unforgiving. The NEM needs roughly 220 to 240 GWh of dispatchable storage and about twice the current solar fleet, because to refill those batteries each day you have to produce 250 to 300 GWh of surplus daytime generation. Lithium alone cannot get us there. Duration economics break down beyond about eight hours. You do not solve a twelve-hour overnight problem by stacking more two-hour batteries. Snowy 2.0 is the calendar-mover for this milestone: 350 GWh of usable storage in a single project, due between 2028 and 2030. With Snowy on time, AEMO’s Step Change scenario delivers a structurally renewable grid by the mid 2030s. Without it, the date drifts toward 2040.
The realistic end-state is not 100% solar plus batteries. It is a portfolio. Solar and wind provide the bulk of the energy. Four to eight hour batteries manage the diurnal cycle. Pumped hydro covers the ten to twenty four hour duration that lithium cannot reach economically. Open cycle gas peakers stay in the mix to cover perhaps one percent of energy on the rare still days when nothing else is available. Interregional transmission ties it all together by letting surplus generation in one state firm demand in another. The first milestone reshapes wholesale price curves within two years. The second restructures the entire generation fleet over the next decade. Both are coming. Neither is automatic.
Why the home battery is the most underrated piece of the puzzle
Snowy 2.0 is one major lever. The other is increasingly sitting in our garages. The Cheaper Home Batteries Program could put Australia on a path toward millions of household batteries by 2030. At perhaps 2 million units and roughly 50 GWh, the home battery fleet would be larger in energy terms than the committed utility-scale battery fleet, and far larger in power terms than Snowy 2.0. Snowy is long-duration storage: 2.2 GW and 350 GWh, or roughly a week at full output. The home battery fleet is shorter-duration, usually two to three hours, but its instantaneous power could be closer to 20 GW than 2 GW. If coordinated, that is not just a collection of appliances. It is infrastructure.
The catch is that almost none of our home batteries are currently coordinated. Around 95% of home batteries are used only for self-consumption, charging from the household’s own rooftop solar during the day and discharging into the household’s own evening load. They are private appliances, not grid resources. The technical name for the alternative is a Virtual Power Plant, or VPP, where a third party coordinates a fleet of household batteries to charge and discharge in response to wholesale and network signals.
There is a perfectly rational reason most people don’t join a VPP. AEMC analysis cited by the ACCC suggests operators may pass through only around half of the economic value created by a VPP to the battery owners. If you spent thousands of dollars on a battery to lower your electricity bill, the proposition “let someone else manage it for you and we’ll give you half the upside” is a hard sell. Most households quite reasonably say no.
That is a pity, because a coordinated 50 GWh distributed storage system could do more than just shift energy from midday to evening. It could also relieve the distribution network, which is stretched thin during the evening peak and almost unused for many hours of the day. Done well, it would defer billions in network augmentation. But getting there requires a value-share that actually motivates households to participate, and that is fundamentally a market design problem rather than a technology one.
That is the next battle. Australia is winning the battery race in hardware. The harder question is whether we can build the market architecture that lets those batteries act together.
Without coordination they remain private appliances. With coordination, they become infrastructure.
That is where the real race begins, and is a story for another post.
New to this topic? See these Battling Entropy Primers to get you up to speed:
Get more like this
New analysis delivered to your inbox. No spam, unsubscribe anytime.
Take care, Tony
Disclosure: Battling Entropy is my independent commentary. The views expressed are my own and do not represent those of any organisation unless explicitly stated. This is not financial or investment advice.
I also have commercial interests in the energy technology field. I am working on a venture, Petajoule Capital, which is developing People-Powered Energy: one particular approach for the coordination of consumer-owned batteries, EVs and flexible demand. This article discusses issues relevant to that work.
Sources / Further Reading
Australian Energy Market Operator. (2026, January). NEM generation information [Data set].
Bistline, J. [@JEBistline]. (2026, April). Battery capacity as a share of total generating capacity, by US state (2018–2027) [Chart, using U.S. Energy Information Administration Form EIA-860
data]. X. https://x.com/JEBistline
Bowen, C. (2026, March 3). Cheaper Home Batteries Program milestone: 250,000 batteries installed, 6.3 GWh of storage [Press release]. Minister for Climate Change and Energy, Australian
Government. https://minister.dcceew.gov.au/bowen
Clean Energy Regulator. (2026, March). SGU — Battery capacity, 2011 to present and totals [Data set]. Australian Government.
https://cer.gov.au/document/sgu-battery-capacity-2011-to-present-and-totals
Clean Energy Regulator. (2026, March). SGU — Solar capacity, 2011 to present and totals [Data set]. Australian Government.
https://cer.gov.au/document/sgu-solar-capacity-2011-to-present-and-totals
Department of Climate Change, Energy, the Environment and Water. (2025, July 1). Cheaper Home Batteries Program. Australian Government.
https://www.dcceew.gov.au/energy/renewable/cheaper-home-batteries-program
U.S. Energy Information Administration. (2026, April). Form EIA-860M: Preliminary monthly electric generator inventory [Data set]. https://www.eia.gov/electricity/data/eia860m/
Further reading:
Australian Competition and Consumer Commission. (2024). Distributed energy resources and aggregator practices in the National Electricity Market. Australian Government. https://www.accc.gov.au
Australian Energy Market Operator. (2024). 2024 integrated system plan for the National Electricity Market.
https://aemo.com.au/energy-systems/major-publications/integrated-system-plan-isp/2024-integrated-system-plan-isp
Australian Energy Market Operator. (2026). Draft 2026 integrated system plan. https://aemo.com.au/-/media/files/major-publications/isp/draft-2026/draft-2026-integrated-system-plan.pdf
California Independent System Operator. (2025). 2025 summer market performance report. https://www.caiso.com/library/market-reports
Snowy Hydro. (n.d.). Snowy 2.0. https://www.snowyhydro.com.au/snowy-20/about/
Discussion
Loading comments...