Battling Entropy Primer
What is the Duck Curve and why does it matter?
Primer #06: Why solar makes electricity cheap at lunch and scarce at dinner
The impact of solar generation on our electricity grid and what we can do to make the system work better. The critical role of storage and how fast it can charge and discharge.
Stand in the middle of the grid for a day and watch what happens. At dawn, demand rises as people wake up. Kettles boil, heaters kick in, industry starts. The system ramps smoothly. This is how the grid was built to behave.
Then the sun comes up.
By late morning, millions of rooftops are generating. Not a little. A lot. Enough to overwhelm local demand in entire suburbs. Power flows backwards up distribution lines that were designed to flow one way. The grid does not see “solar generation”. It sees demand disappearing.
By midday, something remarkable happens. Operational demand collapses. The system looks almost empty.
Prices fall. Sometimes they go negative.
That is not a glitch. It is a signal.
Negative prices are the system shouting two things at once. To generators: stop. To storage: we will pay you to take this energy. Batteries respond instantly. They charge. That is exactly what they are meant to do. Price signals are doing their job: coordinating behaviour in real time.
But there is a limit.
It is not just how much storage exists in total. It is how fast it can absorb energy. The constraint is power, not just capacity. Megawatts, not megawatt-hours. It is not just how much storage there is, it is how fast we can fill it. Once the available charging capacity is full, there is nowhere for the excess energy to go. The system has no choice. It wastes it.
This is the uncomfortable truth of abundance. Having too much energy is still a problem.
Coal-fired generators make this worse. They were built to run steadily. They do not turn down easily, and they certainly do not turn off quickly. When prices go negative, they are being told to get out of the way. Physically and economically, they struggle to comply.
Then the sun sets.
People come home. Lights go on. Cooking starts. Air conditioners kick in. EVs plug in. The solar disappears just as demand surges. The grid has to ramp hard and fast. Gas peakers, hydro, batteries, interconnectors. Everything that can move, moves.
If you plot that shape across the day, it looks like a duck. A deep belly at noon. A steep neck in the evening.
That is the duck curve.
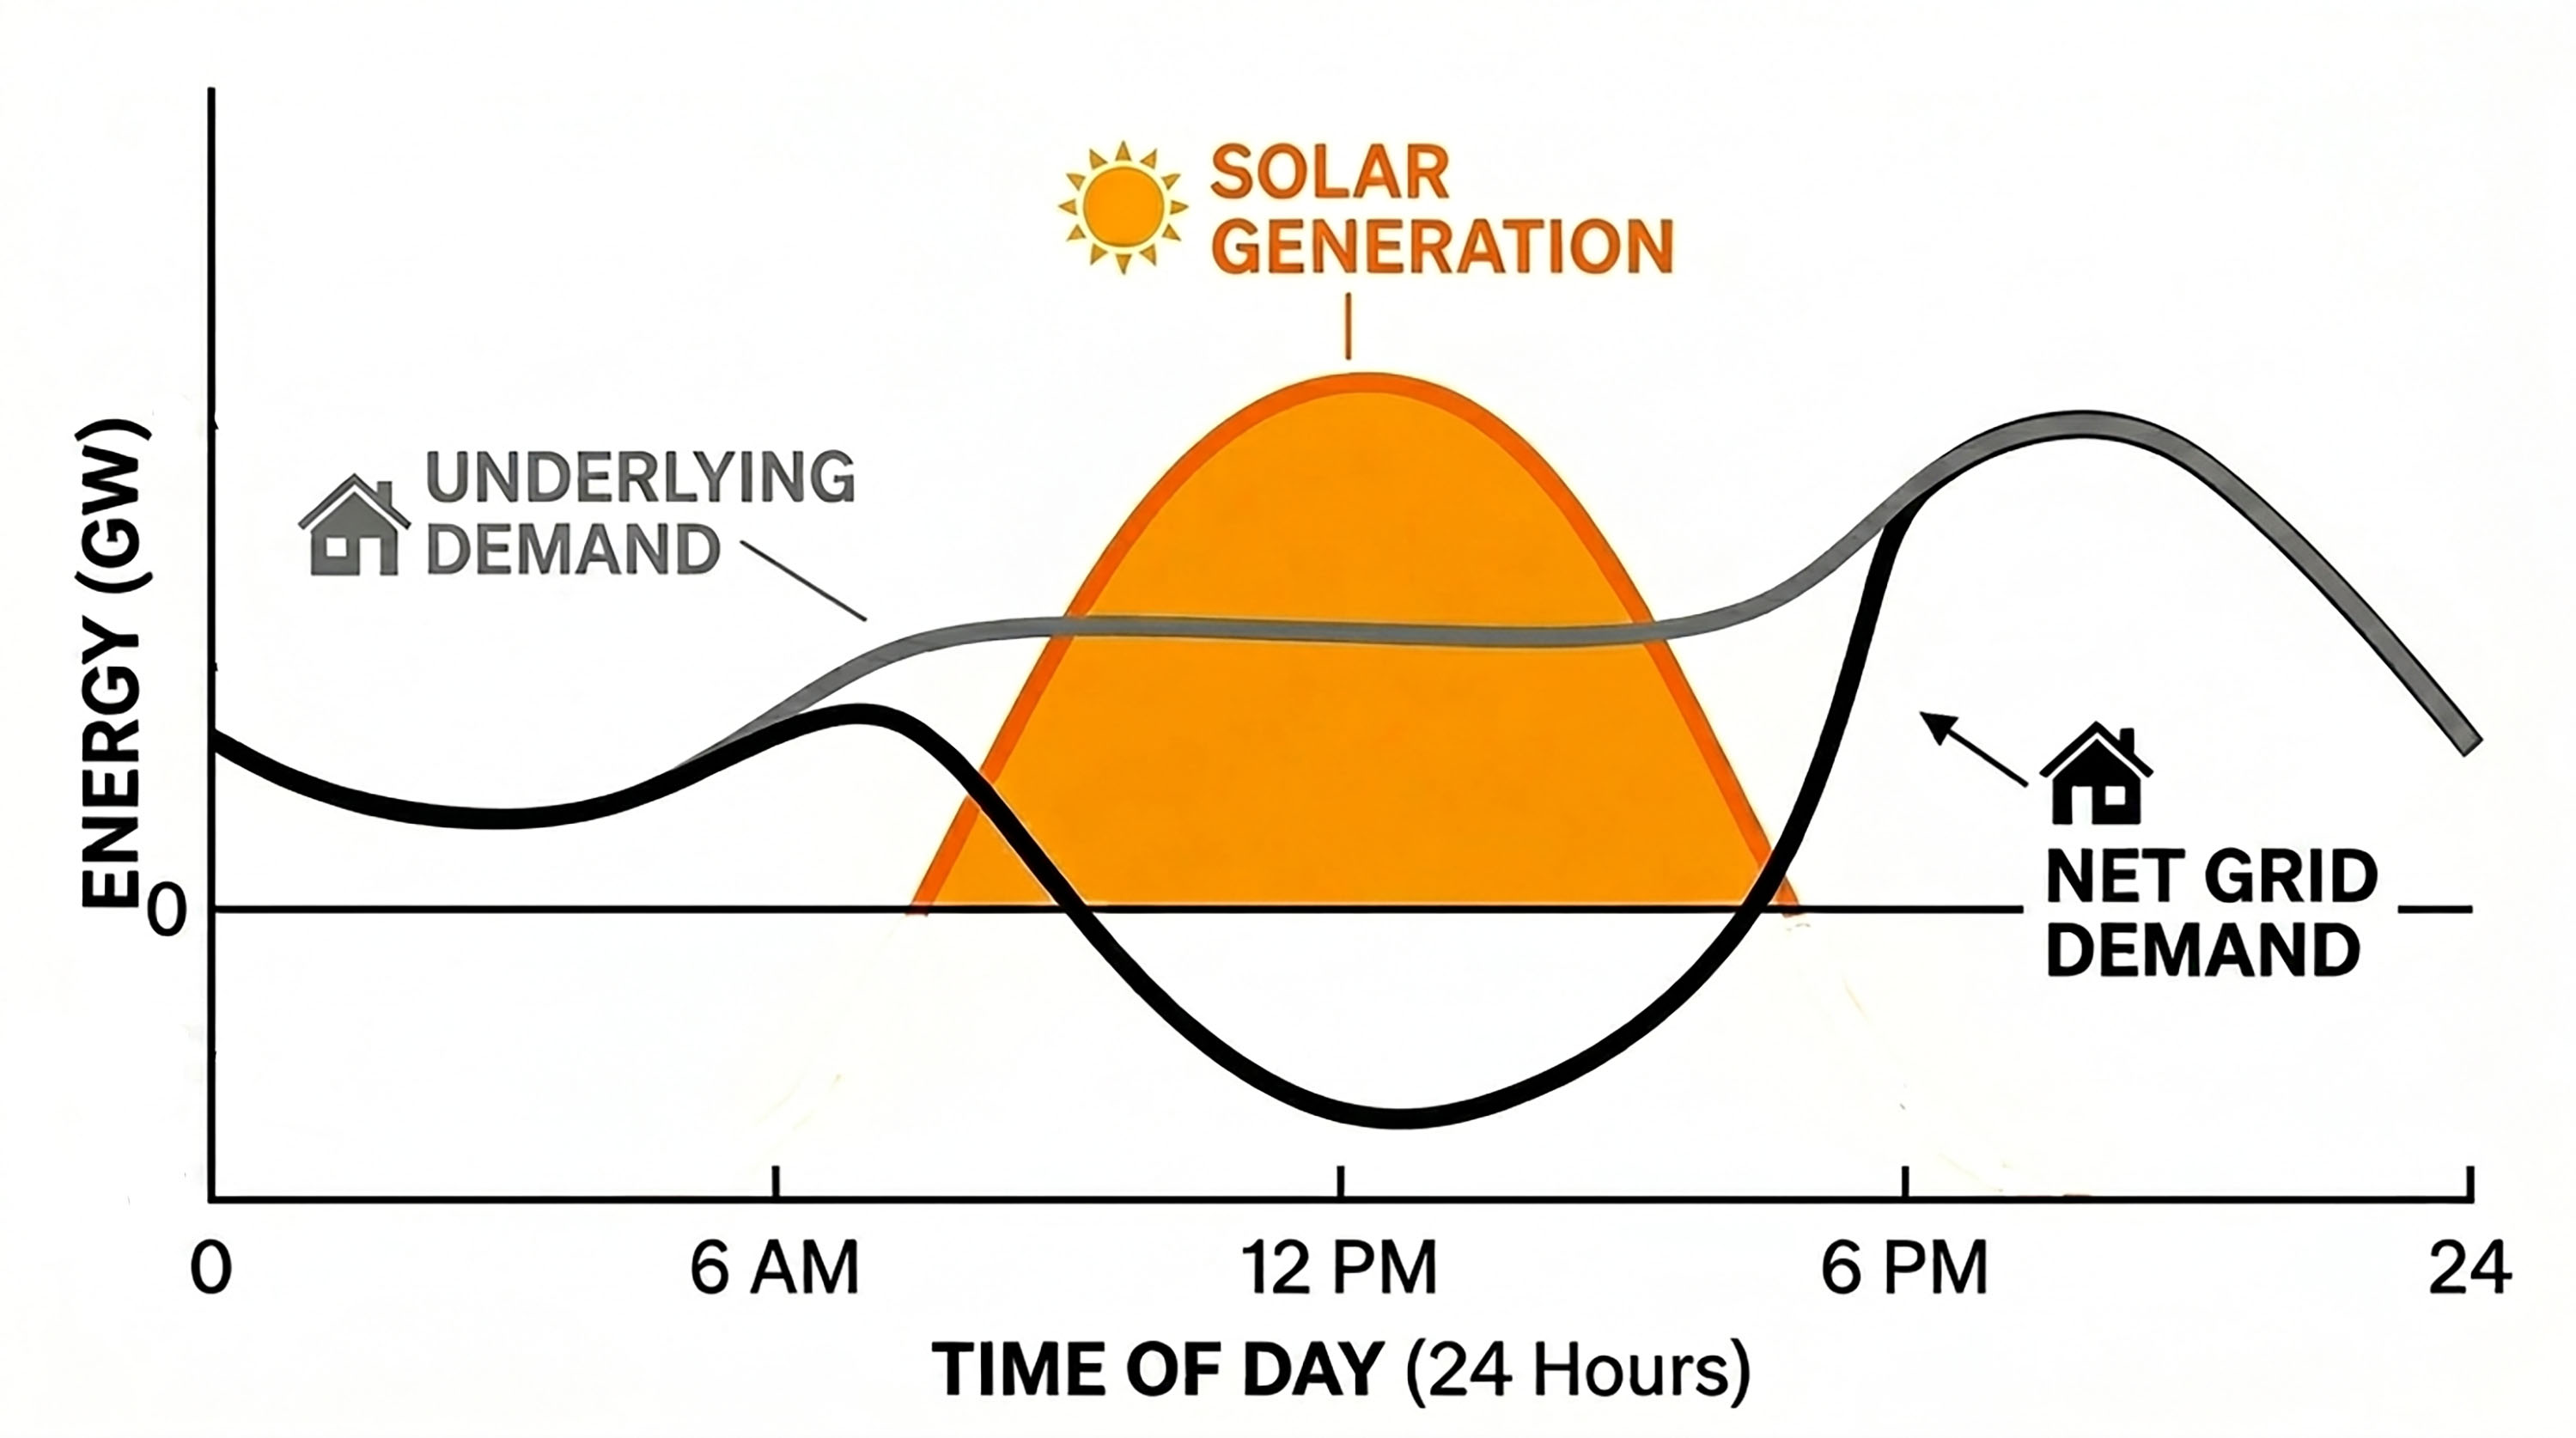
Why “duck curve”? Sit back, half close your eyes and look at the line. Somebody thought it looked like a duck swimming. The name stuck.
It is not a theoretical construct. It is the lived reality of modern power systems, and Australia has one of the most pronounced examples in the world. Rooftop solar has grown so quickly that minimum demand events are now pushing the limits of how low the grid can safely run.
What used to be a system built around scarcity is now, for a few hours a day, a system of abundance.
This changes everything. Electricity is no longer simply “expensive when demand is high”. It is cheap when the sun is shining, regardless of how much energy the system actually needs over the full day. The value of electricity has split across time.
At noon, the problem is too much energy. At 6pm, the problem is not enough. The duck curve is the shape of that mismatch.
For decades, the solution to rising demand was to build more generation. Bigger plants. More capacity. Meet the peak. That logic breaks here. The system already has enough energy. What it lacks is the ability to move energy through time.
The real problem is not generation. It is timing. Once you see this, the priorities change.
Storage is no longer hypothetical. It has become a major feature of the system in the past five years. Grid-scale batteries, household batteries, EVs. They are already shaping prices, soaking up excess energy and releasing it into the evening peak.
But there is still not enough of it.
You can see that in the curve itself. The belly is still deep. The evening ramp is still steep. Storage is working, but it is not yet large or fast enough to fully bridge the gap.
We will know when it is. The duck will start to flatten.
That has begun. In the past year, the most extreme midday dips have softened and the evening ramps, while still sharp, are being partially absorbed. It is early, but the direction is clear.
Batteries are not just backup. They are bridges. They take the excess energy in the belly of the duck and move it into the neck.
Flexible demand becomes valuable. EV charging, hot water systems, industrial processes, data centres. Anything that can shift into the middle of the day helps flatten the belly and ease the ramp.
Networks matter differently. They are no longer just highways delivering power from distant generators. They are platforms coordinating millions of small devices, each responding to local conditions.
Prices matter most of all. If the signal is blunt, the response is blunt. A single regional price struggles to reflect what is happening on a street where solar is flooding the line while a nearby feeder is constrained. The duck exists not just in time, but in space although that aspect is not nearly as well-defined on the NEM.
The deeper point is this. The energy transition is not short of energy. It is short of coordination.
The duck curve is often framed as a problem caused by solar. It is not. Solar has revealed a problem that was always there but never visible: electricity is produced and consumed in real time, and until recently the system had very limited ways to shift between the two. The abundance of batteries is changing that.
Now we have abundance for part of the day, scarcity for another, and a growing fleet of devices that can bridge the gap if given the right signals.
The duck is telling us something simple.
We do not need more energy at noon. We need more bridges to move noon into evening.
Take care, Tony
Further reading
Australian Energy Market Commission. (2018). Coordination of generation and transmission investment: Final report. Australian Energy Market Commission.
Australian Energy Market Commission. (2019). Coordination of generation and transmission investment: Access reform directions paper. Australian Energy Market Commission.
Australian Energy Market Operator. (2024, December 2). Minimum operational demand. https://aemo.com.au/newsroom/media-release/minimum-operational-demand
Australian Energy Market Operator. (n.d.). Quarterly Energy Dynamics. https://aemo.com.au/energy-systems/major-publications/quarterly-energy-dynamics-qed
California Independent System Operator. (2016). What the duck curve tells us about managing a green grid. https://www.caiso.com/documents/flexibleresourceshelprenewables_fastfacts.pdf
Energy Information Administration. (2023, June 21). As solar capacity grows, duck curves are getting deeper in California. U.S. Energy Information Administration. https://www.eia.gov/todayinenergy/detail.php?id=56880
International Energy Agency. (n.d.). The California duck curve. https://www.iea.org/data-and-statistics/charts/the-california-duck-curve
Finncorn Consulting. (2021). Submission to the Energy Security Board in response to the Post-2025 Market Design Options Consultation Paper.
Finncorn Consulting. (2022). Submission to the Energy Security Board in response to the Transmission Access Reform Directions Paper.
Murray, C. (2024). Counteracting the duck curve: Prosumage with time-varying import and export tariffs. Energy Policy. https://www.sciencedirect.com/science/article/pii/S0301421524004816
Parkinson, G. (2026, April 28). AEMO looks to EVs, data centres and industry to help ease overload of rooftop PV in middle of day. RenewEconomy. https://reneweconomy.com.au/aemo-looks-to-evs-data-centres-and-industry-to-help-ease-overload-of-rooftop-pv-in-middle-of-day/
PV Tech. (2025, October 6). Australia’s NEM sets minimum demand record as rooftop solar reaches 15GW. https://www.pv-tech.org/australias-nem-sets-minimum-demand-record-as-rooftop-solar-reaches-15gw/
WattClarity. (2026, January). AEMO releases the Q4 2025 Quarterly Energy Dynamics report. https://wattclarity.com.au/articles/2026/01/aemo-releases-the-q4-2025-quarterly-energy-dynamics-report/