On the Street Where You Live
Issue #23: The low-voltage network running down your street is way more interesting than you think. And so is the money being spent on it.
American regulators are discovering that the fastest-growing part of the electricity bill — distribution spending — is approved in a black box. Australia built a better machine for scrutinising that spend, but its gaze stops well above the street, and the street is exactly where the transition is landing: century-old low-voltage networks built to push power one way now carry solar exports, EV charging, batteries and heat pumps in every direction at once. The quiet one-way street has become a multi-lane highway. Some local networks are coping just fine. Some are struggling. Depending on where you live, there is a rich public record that tells you exactly how yours is faring — down to the transformer on the corner, in fifteen-minute steps. And that record, properly published, could change who gets to decide what the fix is.
A billion dollars in a black box
Last week I listened to a Volts episode that has been rattling around my head ever since. (A quick plug here for David Roberts' Volts podcast at volts.wtf. Essential listening for all grid geeks!) In this episode, David Roberts sat down with two Minnesota regulators, Sydnie Lieb and Pete Wyckoff, to talk about a part of the American electricity bill that almost nobody scrutinises: distribution spending. The numbers are startling. Distribution used to be about ten per cent of a US integrated utility's capital budget — the rounding error, the boring bit. It is now pushing thirty per cent, on par with generation and transmission, and it is the single biggest driver of rising American power bills. Yet where generation and transmission investment must survive elaborate modelling, public consultation and economic optimisation before a dollar is approved, distribution spending is waved through as "non-discretionary". Necessary engineering. Trust us.
The incentive underneath is not subtle. American investor-owned utilities earn a regulated return on capital they build and merely pass through what they spend on operations. So undergrounding a line — new capital — beats trimming the trees around it, even when trimming is dramatically cheaper for the same reliability. Lieb's team found utilities valuing an hour of lost load on a suburban distribution feeder at more than fifty per cent above what the entire MISO wholesale market — industrial load and all — values an hour of lost supply. Value reliability highly enough and you can justify building almost anything. And the only test the spending must pass afterwards is "prudence", which asks whether the utility paid a fair market price for the widget — not whether the widget was needed, nor whether something cheaper could have done the job. As Wyckoff put it: "Can you beat a placebo of doing nothing?"
An Australian reader is entitled to a moment of smugness here. But only a moment.
The machine we made
Australia regulates its distribution networks quite differently, and mostly better. Our DNSPs don't file piecemeal rate cases; they submit five-year regulatory proposals to a single national regulator, the AER, which interrogates and benchmarks the capital expenditure forecast before approving a revenue envelope. And critically, the incentive properties are engineered rather than accidental. Under the capital expenditure sharing scheme, a network that overspends its approved allowance wears roughly thirty per cent of the overrun itself, and a network that underspends keeps a share of the saving — so the crude American pathology, where every extra dollar of capital is simply an extra dollar of return, is blunted at the source. The scrutiny also has teeth after the fact: the AER reviews actual spending against the allowance and adjusts. In its April 2026 determination for AusNet Services, the regulator applied a sharing-scheme revenue decrement of $134.7 million for overspending in the previous period. That is real money handed back toward customers. No Minnesota commission does anything comparable.
But before we congratulate ourselves entirely, notice what this machine actually sees. It tests the envelope — whether the network's total five-year capital programme is efficient in aggregate, benchmarked against peers and history. What it cannot see, and was never designed to see, is whether a particular transformer in a particular street should have been upgraded at all, or whether something else — trimmed demand, a shifted export, a battery on the corner — would have done the same job for less. The return on the regulatory asset base is still the heart of the business model (regular readers will remember Issue #20, The Forty-Year Bill), so the gravitational pull toward capital has not gone; it has merely been given a counterweight. And the one mechanism we do have for contesting individual projects in public has a floor set far, far above the street. Hold that thought. Because to understand why it matters, you first have to understand what is happening on the street.
The most boring machine in the world
Ask someone to picture the grid and they will conjure transmission towers marching across a plain. High voltage. Steel lattice. The big infrastructure that moves gigawatts across states. But the part of the grid that touches your daily life is far smaller and humbler: the low-voltage network running down your street, the cable under the footpath, the transformer humming on the pole or in the green box on the corner. The very bottom of the system. The last few hundred metres.
For a century, this end of the grid had the easiest job imaginable. Power flowed one way — from the transformer, down the street, into homes that did nothing but consume. The network was sized for the day's peak and otherwise forgotten. A distribution engineer could plan it with a slide rule and a weather almanac. It was, by design, the most boring machine in the world.
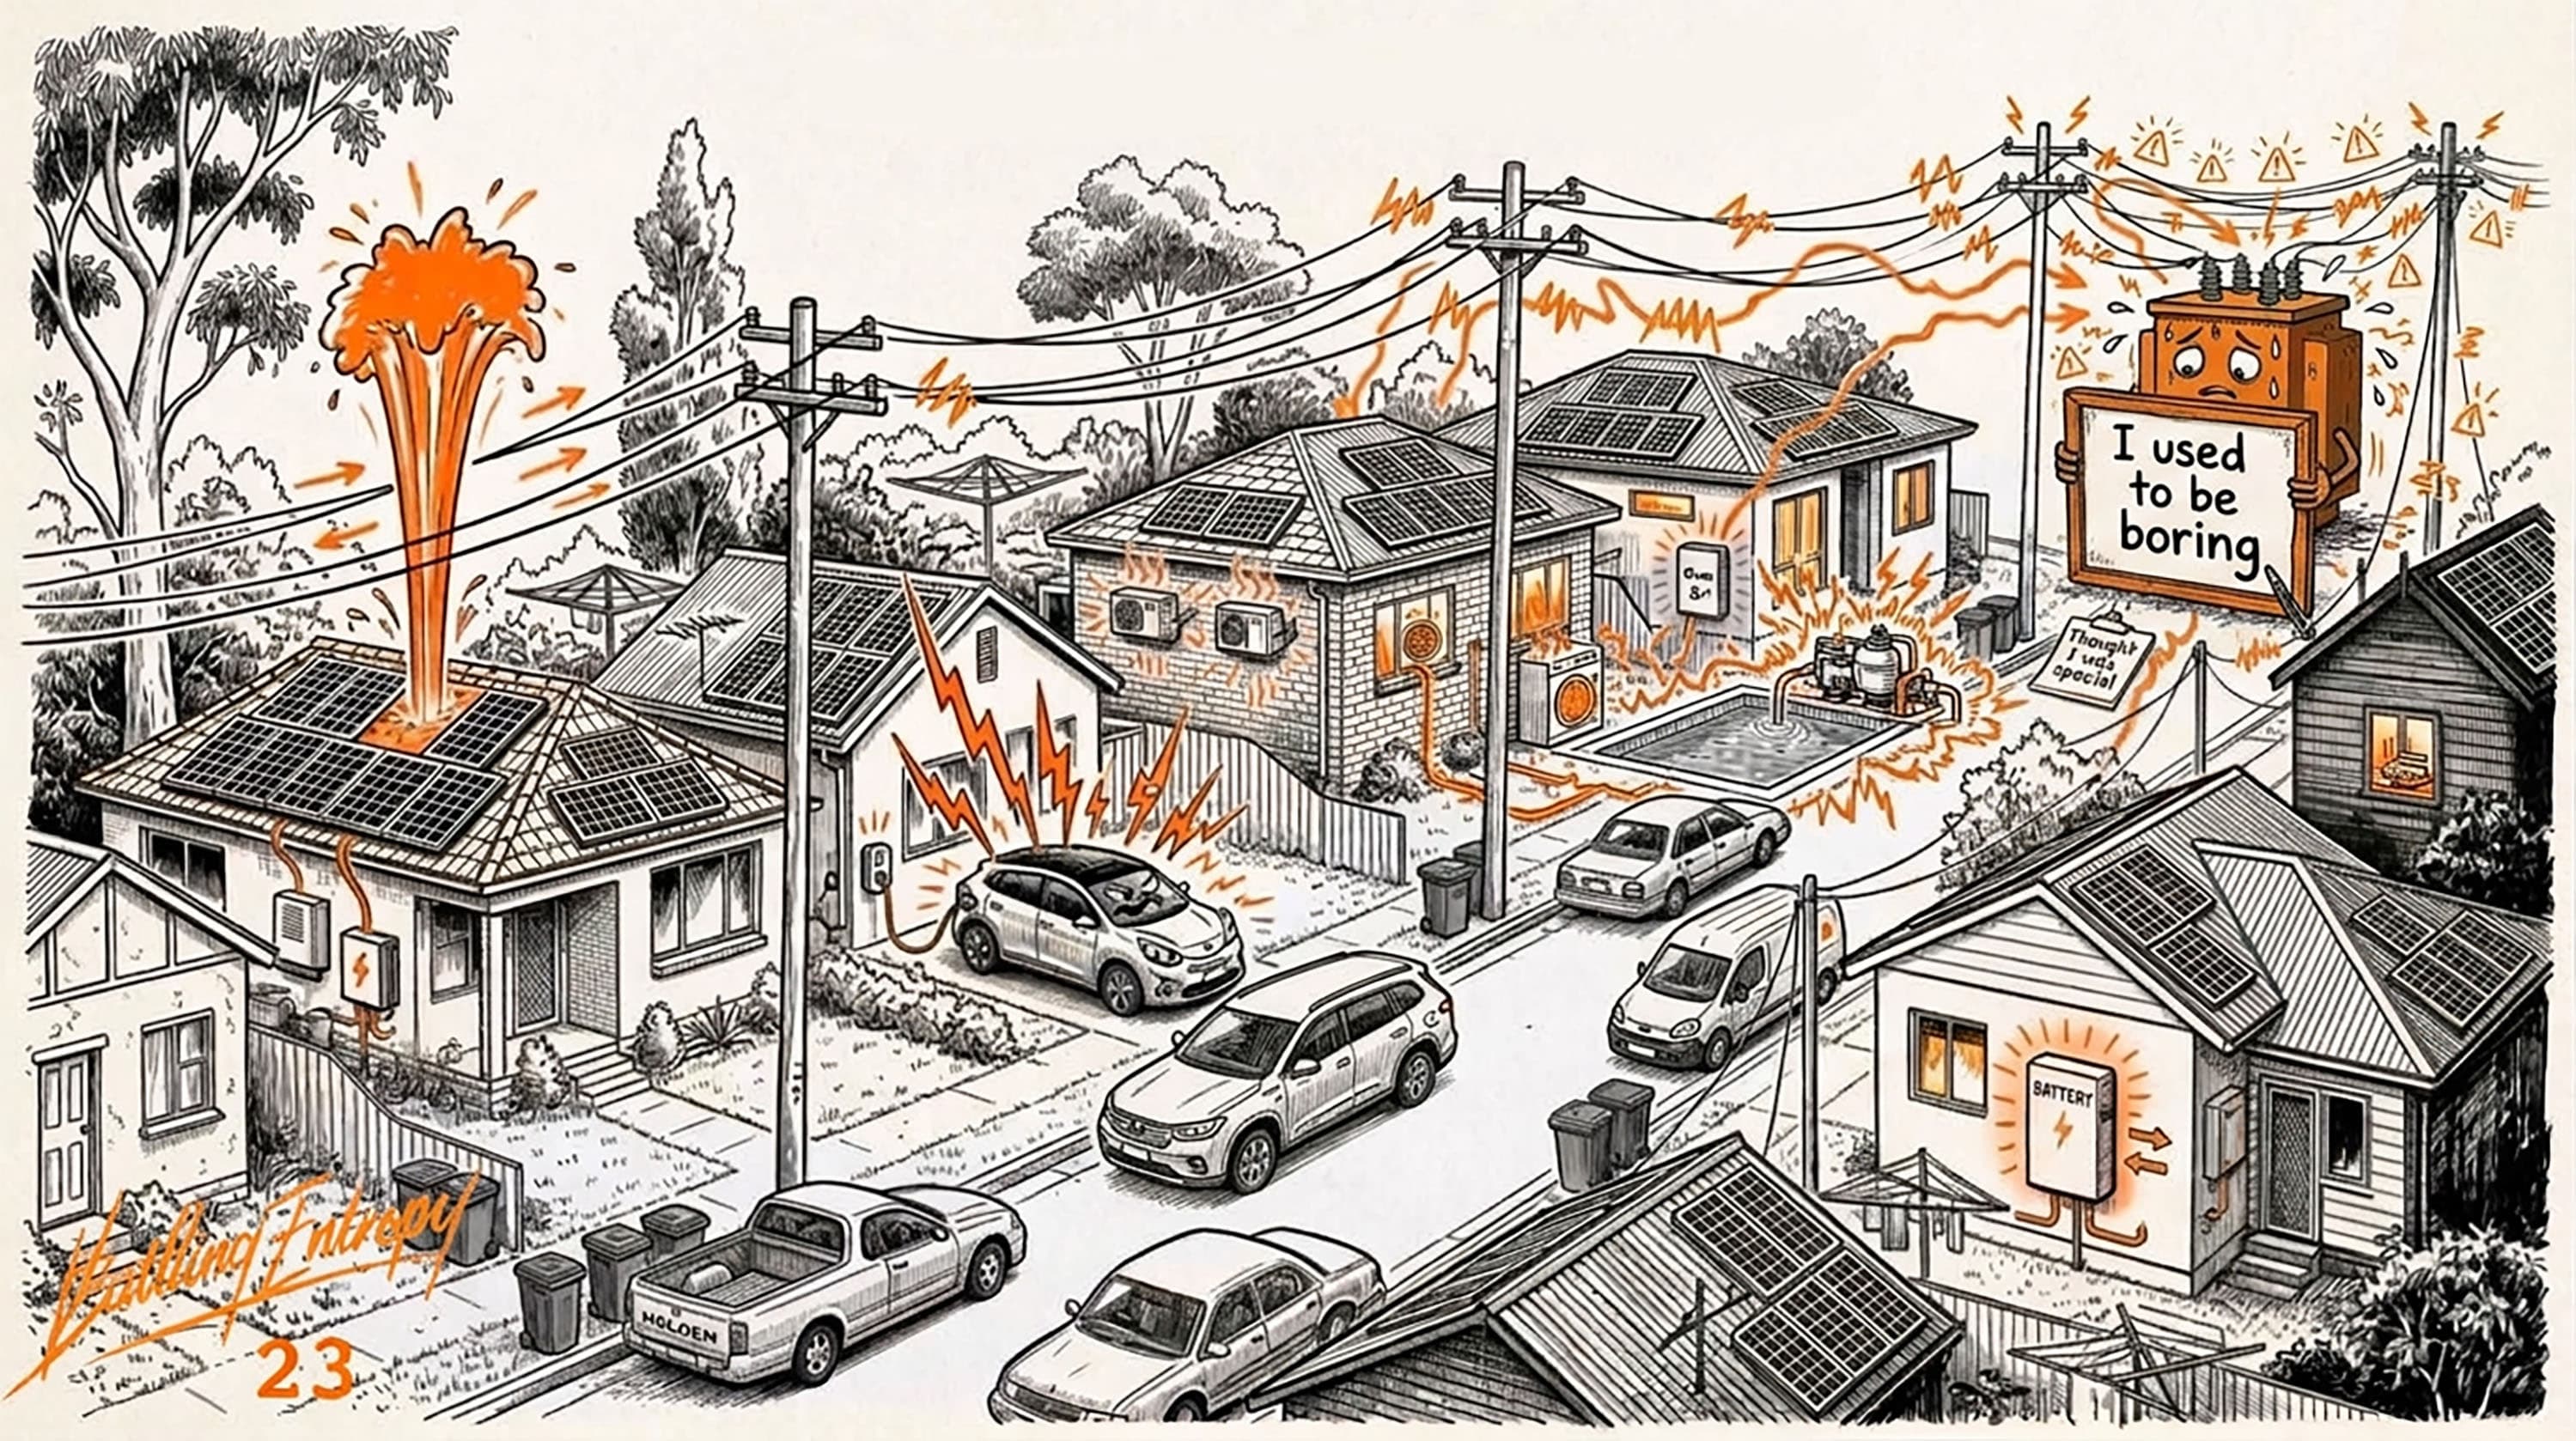
Then the suburbs filled with devices it was never built for. Rooftop solar pushes power backwards up the street at midday, lifting the local voltage until inverters trip or are ordered to throttle their exports. Electric cars each draw as much as a whole house, often plugged in at the same evening hour. Home batteries import at one moment and export at the next. Heat pumps, induction cooktops, pool pumps and air conditioning pile on as electrification advances room by room, appliance by appliance. Power now flows down the street, up the street, and — in truth — from one neighbour's roof to another's battery to a third's car. The quiet one-way street has become a multi-lane highway, with traffic merging and overtaking in every direction, and here and there beginning to jam.
Some local networks are coping just fine. Some are struggling. And which is which is not something you can read off a national statistic, because this is where the abstractions of the market meet the stubbornness of physics. Voltage, unlike price, cannot be averaged across a state. It is set locally, by what the houses on one particular street are doing in one particular moment. A rooftop array in Blacktown does not care what the wholesale spot price is in Bourke. It cares whether the transformer at the end of the street can absorb another kilowatt without the local voltage climbing above 253 volts and forcing the inverter to curtail. And streets are wildly uneven. One may be straining at its limits whilst the next street over, with fewer panels or a newer transformer, sails along untroubled. The market operator sees aggregate demand across millions of customers. The transformer on the pole sees thirty-six houses, two Teslas, four home batteries and eleven rooftop solar systems, all doing different things at different times.
So the obvious question: how is your street doing?
The transformer keeps a diary
I went looking for an answer, and found something I did not expect: depending on where you live, the record is astonishingly rich — and public.
The standout is AusNet Services, the distribution network covering eastern and north-eastern Victoria. Every low-voltage distribution transformer on that network is online: loads, reverse flows, ratings and connected solar, published at fifteen-minute intervals, for anyone to download. Not a modelled estimate. Not an annual summary. The actual diary of the actual iron on the actual pole.
So let us pick one. Take Berwick, on Melbourne's south-eastern edge, in the City of Casey — AusNet country, and about as representative of the modern frontier as a suburb gets: growing fast, roofed in silicon, wired for a quieter decade than the one it now inhabits. The macro picture for Casey is three numbers. In seven years its connections have risen by about thirty-five per cent. Its installed rooftop solar has grown more than fivefold, to some 262 megavolt-amperes. And roughly 231 of those megavolt-amperes are now approved to export — to push power, at exactly the sunlit hours, back up exactly those streets.
Download the fifteen-minute trace for a sample of Berwick's residential transformers, average each by time of day, and the duck is unmistakable — drawn not by a market operator but by the houses themselves. Through the small hours the load sits at a modest baseline; it sags through the middle of the day until, on the average street, the transformer is carrying almost nothing, the solar overhead very nearly feeding the load beneath it; and then, as the sun drops and the ovens and the car chargers come on, it climbs to an evening peak perhaps eight times the midday trough. Eight to one, on iron sized for a world that only ever went one way.
Twenty streets, ranked
But the average street is a fiction, and the whole point of this data is that it lets you stop averaging. Here are twenty of Berwick's residential low-voltage networks — real transformers serving real streets — each lined up against its own nameplate rating and its own approved export limit, ranked from most constrained at the top to most headroom at the bottom.
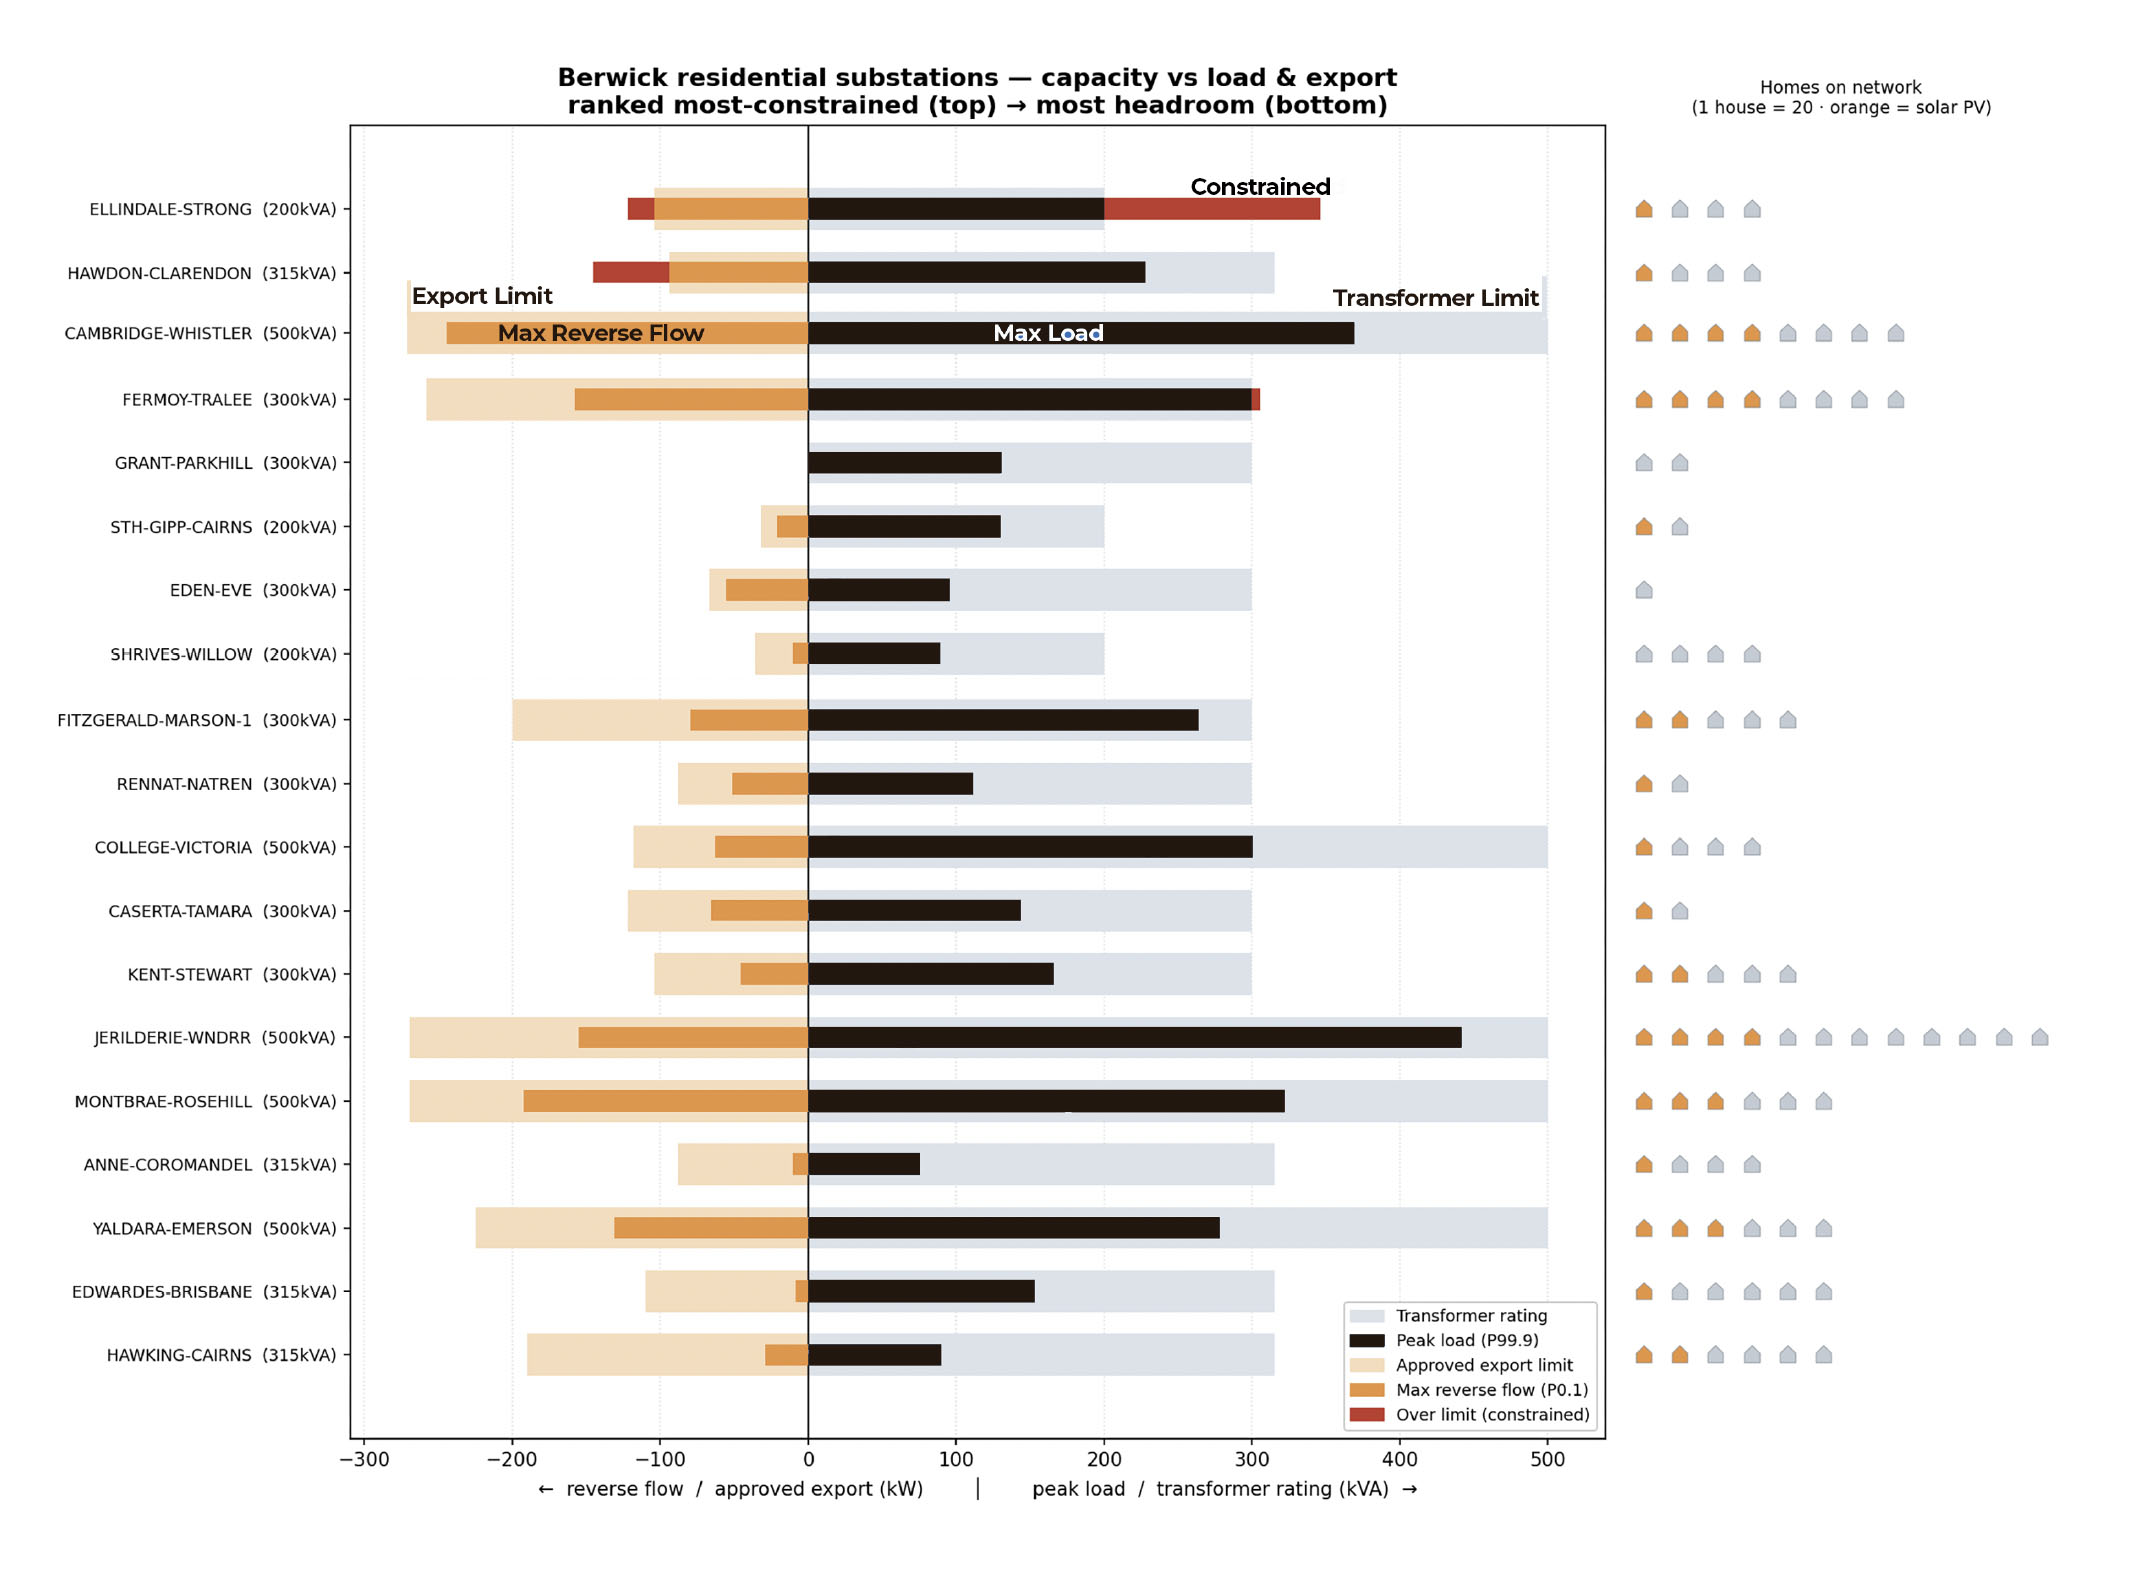
What does this picture tell us? Three things.
First, this network is stressed far more on the way out than on the way in. The right side of the chart shows each transformer's load limit — almost always a thermal limit, set by how much current the iron can carry before it cooks. The left side shows the export limit, and it is invariably smaller. That limit is typically set by voltage, not heat. To export onto the grid, a home inverter must lift its voltage slightly above the network's; many exporting inverters in close proximity push each other higher, and the street's voltage escalates towards the regulatory ceiling. The binding constraint on the suburban grid is not usually people drawing too much power in the evening. It is people making too much of it at lunchtime.
Second, the stress follows the sunlight with almost embarrassing fidelity. Rank the transformers by how hard they press against a limit in either direction and the ones at the top are, almost without exception, the ones carrying the most rooftop solar. Here and there a single transformer is stressed on both faces at once — over its thermal rating in the evening and over its export limit at noon, the multi-lane highway jammed in both directions on the same day. The constraint is not bad luck, nor merely old age. It is being manufactured, cleanly and predictably, by the thing we have bolted to our roofs by the million.
Third, a caution: unprocessed public data is often not tidy data. The raw maxima and minima are salted with obvious nonsense — a ten-kilovolt-ampere (KVA) pole transformer that supposedly peaked near five hundred, reverse flows an order of magnitude larger than the solar that could conceivably cause them. Take the extremes at face value and you will invent constraints that were never there. I've been through the data and removed the obvious nonsense which, to be fair, was a small fraction of a percentage of all data. The record is real, and open, and yours to read; but it isn't pre-chewed.
Is your DNSP here?
AusNet sets the benchmark for depth, but it is not alone. Every distribution network service provider in the NEM now publishes something about network capacity and hosting; what varies — enormously — is how far down the system the picture reaches. Some stop at the zone substation, a resolution of tens of thousands of customers. Some reach the feeder. A precious few reach the street.
| DNSP | Region | What's published | Depth |
|---|---|---|---|
| AusNet Services | E/NE Victoria | Per-substation 15-min load traces, ratings, solar — map + export | ★★★★★ |
| Endeavour Energy | W Sydney, Illawarra | Substation available capacity + coordinates — open API / CSV | ★★★★★ |
| Energex | SE Queensland | Per-transformer load + export hosting, by address — map | ★★★★ |
| Ergon Energy | Regional Qld | Feeder + transformer load / export hosting — map | ★★★★ |
| Ausgrid | Sydney, Hunter | Feeder capacity + generation hosting — map + export | ★★★ |
| CitiPower | Inner Melbourne | Zone / feeder capacity, DER hosting — map + export | ★★★ |
| Powercor | W Vic / Melbourne | Zone / feeder capacity, DER hosting — map + export | ★★★ |
| United Energy | SE Melbourne | Zone / feeder capacity, DER hosting — map + export | ★★★ |
| SA Power Networks | South Australia | Zone / feeder capacity, hosting — map | ★★★ |
| Essential Energy | Regional NSW | Zone substation + feeder — map / PDF | ★★ |
| Evoenergy | ACT | Zone substation + feeder — map / PDF | ★★ |
| TasNetworks | Tasmania | Zone substation + feeder — map / PDF | ★★ |
| Jemena | NW Melbourne | Zone substation + feeder — map / PDF | ★★ |
Notice, though, that nobody sits in the "perfect" corner of this landscape. AusNet's GridView is the richest record in the country — the actual fifteen-minute diary of every transformer — but it lives behind a map interface built for human eyes, one substation at a time. It is not machine-interrogable. Endeavour Energy, meanwhile, has the slickest plumbing in the country — a clean open API, coordinates, CSVs, everything a piece of software could want — but the data behind it is thinner. One network built the library; the other built the search engine. Combine the two — AusNet's depth behind Endeavour's interface — and you would have something genuinely remarkable: a continuously updated, queryable map of exactly where the grid's edge is strained, open to anyone.
Which raises the obvious question: why should a DNSP bother?
Contestability and savings, all the way down
Here is where the Minnesota conversation comes home. Because Australia already has the answer in principle — we wrote it into the rules years ago. It is called the Regulatory Investment Test for Distribution, the RIT-D, and it is precisely the thing Lieb and Wyckoff are begging their utilities to adopt. Before a DNSP commits to a network project above the cost threshold, it must publish the identified need — what problem, where, why — then identify credible options including non-network options, invite the market to propose alternatives, run a transparent cost-benefit analysis, and justify the preferred option in public. Not "did you pay a fair price for the widget" but "did you need the widget, and could something else have done the job". Contestability, by design.
There is just one catch: the threshold. The RIT-D only applies to projects above $7 million. Every transformer in the Berwick chart — every constraint that the fifteen-minute data reveals, forming and tightening street by street — sits two orders of magnitude below that line. The multi-billion-dollar wave of spending now heading for the grid's edge will arrive not as a handful of contestable seven-million-dollar projects but as tens of thousands of small ones: a transformer swap here, a feeder augmentation there, each individually modest, each bundled into the aggregate capex envelope, each decided the old way — internally, invisibly, as engineering necessity. Not because our rules permit black boxes. Because we drew the contestability boundary at a scale that made sense when the edge of the grid was the rounding error. It is not the rounding error any more.
The traditional objection is practical, and it used to be decisive: you cannot run a months-long public consultation over every pole transformer. The administrative cost would swamp the asset. Quite right — when the need was invisible and the consultation was a PDF. But look again at what AusNet and Endeavour have built between them. Publish per-transformer loading continuously, make it machine-interrogable, and the identified need publishes itself — every fifteen minutes, at zero marginal cost, for every street at once. A third party no longer requires a consultation; it requires a query. A battery proponent could scan every constrained transformer in a franchise area overnight and price a non-network offer against the network's standard fix. And this is exactly where technology has moved the goalposts: a local battery, placed on the right corner and operated against the right constraint, may now deliver the same relief as a transformer upgrade for less — soaking up the midday export that sets the voltage ceiling, shaving the evening peak that sets the thermal one, working both faces of the jam at once. Today, nobody is positioned to discover whether that is true on any given street, because nobody outside the network can see the need, and no process exists to receive the offer at that scale.
The DNSPs, note, are not the villains of this piece — and they are not even the losers. Our incentive schemes already pay them to find the cheaper answer: a network that meets a constraint with a $40,000 battery service instead of a capital upgrade keeps a share of the saving, under the very sharing scheme that penalised the overspend. Open data makes their own capex proposals easier to defend to the AER and to consumer advocates — Wyckoff's refrain, show us the data, cuts both ways. And the direction of travel down that table is unmistakable: the once-invisible bottom of the grid is coming into public view, network by network. The question is whether we let the view arrive with the machinery to act on it — a standing, automated, feeder-level descendant of the RIT-D, less a bureaucratic process than a market interface — or whether we spend the next decade replacing iron in the dark and calling it non-discretionary.
What does it all mean?
Here is the insight worth carrying away. The grid is not one problem with one solution. It is thousands upon thousands of local problems, each with its own street, its own mix of solar and cars and heaters, its own moment of stress — and now, increasingly, its own line item. A single national figure for demand, for spare capacity, or for efficient capital expenditure hides this completely. AEMO can publish a forecast showing ample generation headroom across the NEM, and the AER can approve a capex envelope that is entirely efficient in aggregate — and both can be right — while somewhere in the outer suburbs a street full of solar panels is pinned at the regulatory voltage ceiling at noon, and the fix being quietly specified for it is the expensive one, because no one else was allowed to look. The strain is granular. The spending is granular. The scrutiny should be too.
Which leaves the inference I find genuinely cheering. The distribution grid — the least glamorous, most invisible stratum of the whole apparatus — has quietly become a live thermodynamic argument, conducted street by street, between a century of one-way engineering and a decade of multi-directional physics. It is fighting, in fifteen-minute steps, to hold local order against a rising tide of decentralised, intermittent, bidirectional energy. Minnesota's regulators are trying to prise open their black box with crowbars. Ours is already ajar: for once you need not take an operator's word for how the fight is going, or what it should cost. You can pull the transformer's diary, on your own street, and read it yourself.
If entropy is the price the universe charges for keeping anything organised, the edge of the grid is where a surprising share of that bill is now falling due — locally, granularly, and in plain sight. The least we can do is read the bill before we pay it.
New to this topic? See these Battling Entropy Primers and prior articles to get you up to speed:
Get more like this
New analysis delivered to your inbox. No spam, unsubscribe anytime.
Take care, Tony
Disclosure: Battling Entropy is my independent commentary. The views expressed are my own and do not represent those of any organisation unless explicitly stated. This is not financial or investment advice.
I also have commercial interests in the energy technology field. I am working on a venture, Petajoule Capital, which is developing People-Powered Energy: one particular approach for the coordination of consumer-owned batteries, EVs and flexible demand. This article discusses issues relevant to that work.
Sources / Further Reading
Ausgrid. (n.d.). Distribution and transmission annual planning report data portal. Retrieved July 7, 2026, from https://dtapr.ausgrid.com.au/
AusNet Services. (n.d.). Distribution annual planning report data portal. Retrieved July 7, 2026, from https://dapr.ausnetservices.com.au/
AusNet Services. (n.d.). GridView portal. Retrieved July 7, 2026, from https://gridview.ausnetservices.com.au/
AusNet Services. (n.d.). GridView — our interactive public map of the electricity distribution network. https://www.ausnetservices.com.au/electricity/network-information/gridview-portal
AusNet Services. (2025). Understanding distribution substation data on GridView [Fact sheet]. https://www.ausnetservices.com.au/-/media/project/ausnet/corporate-website/files/electricity/gridview/2025/understanding-distribution-substation-data-on-gridview.pdf
Australian Energy Regulator. (2024, November 12). Final determination: 2024 cost thresholds review for the regulatory investment tests. https://www.aer.gov.au/industry/registers/resources/reviews/2024-cost-thresholds-review-regulatory-investment-test/final-determination
Australian Energy Regulator. (2025, August). Capital expenditure incentive guideline for electricity network service providers. https://www.aer.gov.au/system/files/2025-08/AER%20Capital%20Expenditure%20Incentive%20Guidelines%20-%20August%202025.pdf
Australian Energy Regulator. (2025, May). Regulatory investment test for distribution: Application guidelines (Version 6). https://www.aer.gov.au/system/files/2025-05/AER%20-%20Regulatory%20Investment%20Test%20for%20Distribution%20application%20guidelines%20-%202024%20-%20Version%206.pdf
Australian Energy Regulator. (2026, April). Final decision — AusNet Services distribution determination 2026–31: Attachment 6 — Capital expenditure sharing scheme. https://www.aer.gov.au/system/files/2026-04/AER%20-%20Attachment%206%20-%20Capital%20expenditure%20sharing%20scheme%20-%20Final%20decision%20-%20AusNet%20Services%20Distribution%20determination%202026-31%20-%20April%202026_0.pdf
CitiPower & Powercor. (n.d.). Network data (Network Visualisation Portal, DAPR, distribution substation report data). Retrieved July 7, 2026, from https://www.powercor.com.au/network-planning-and-projects/network-data/
CitiPower & Powercor. (n.d.). Network visualisation portal. Retrieved July 7, 2026, from https://dapr.powercor.com.au/ Endeavour Energy. (n.d.). Network capacity map. Retrieved July 7, 2026, from https://www.endeavourenergy.com.au/our-network/network-demand-and-capacity/network-capacity-map
Endeavour Energy. (n.d.). Open data portal. Retrieved July 7, 2026, from https://data.endeavourenergy.com.au/explore/
Energex & Ergon Energy Network. (n.d.). Network load & export capacity map. Retrieved July 7, 2026, from https://www.energex.com.au/about-us/company-reports,-plans-and-charters/network-load-capacity-map
Energex & Ergon Energy Network. (n.d.). Network load capacity map user guide. https://www.energex.com.au/about-us/company-reports,-plans-and-charters/network-load-capacity-map/network-load-capacity-map-user-guide
Essential Energy. (n.d.). Distribution annual planning report data portal. Retrieved July 7, 2026, from https://dapr.essentialenergy.com.au/
Evoenergy. (n.d.). Annual planning report data portal. Retrieved July 7, 2026, from https://apr.evoenergy.com.au/ Jemena. (n.d.). Network planning (2025 DAPR and interactive Digital DAPR Map). Retrieved July 7, 2026, from https://www.jemena.com.au/electricity/jemena-electricity-network/network-information/network-planning/
NSW Department of Climate Change, Energy, the Environment and Water. (n.d.). Network hosting capacity opportunities map. Retrieved July 7, 2026, from https://www.energy.nsw.gov.au/nsw-plans-and-progress/regulation-and-policy/electricity-supply-and-reliability-check/network-hosting-capacity-opportunities-map
Roberts, D. (Host). (2026, July 8). Forcing utilities to justify their distribution-system spending [Audio podcast episode]. In Volts. https://www.volts.wtf/podcast (replace with direct episode URL)
SA Power Networks. (n.d.). Network visualisation portal. Retrieved July 7, 2026, from https://dapr.sapowernetworks.com.au/
TasNetworks. (n.d.). Planning our network. Retrieved July 7, 2026, from https://www.tasnetworks.com.au/poles-and-wires/planning-and-upgrades/planning-our-network
United Energy. (n.d.). Network data. Retrieved July 7, 2026, from https://www.unitedenergy.com.au/network-management/network-data
Discussion
Loading comments...